If you have a Parent/Child configuration that consolidates multiple applications under a single contract and billing quota, the chart displayed in Settings > Billing > Usage Details > Usage Breakdown shows the total record count across all parent and child applications, rather than the count for an individual application.
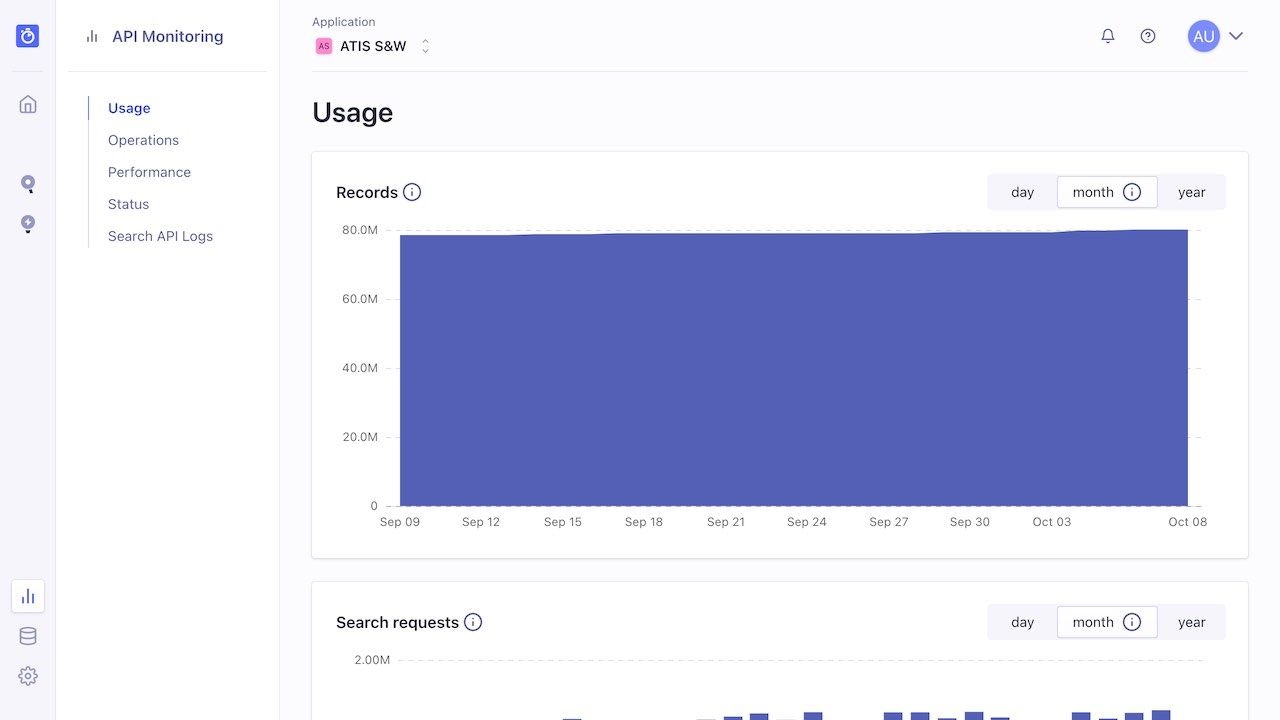
To view the record count for a specific application, go to API Monitoring > Usage within the application you want to review.
Note that the Records graph in this section always reflects your monthly usage (as the default view), regardless of whether you’re on a monthly or annual subscription.
If you see a spike in record usage in the API Monitoring section of your dashboard, this can be due to a number of reasons which are outlined here.